Power BI Data Transformation and Interactive Analysis
A reporting workflow that turns raw spreadsheet data into a structured model and interactive healthcare insights.
The challenge
What needed to be solved
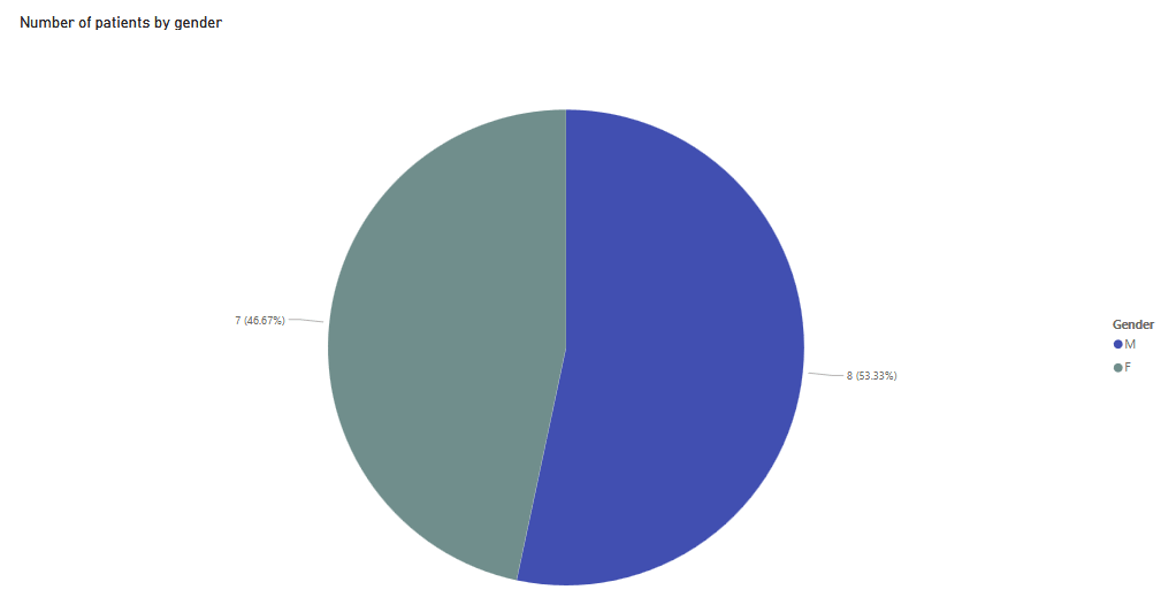
Convert raw spreadsheet data into an accurate, navigable report that helps a user understand patient demographics, role assignments, locations, and treatments.
The approach
How I worked through it
I cleaned and typed the data in Power Query, removed duplicates and empty rows, created calculated fields and measures, and designed reports with filters and slicers.
The result
What the work demonstrated
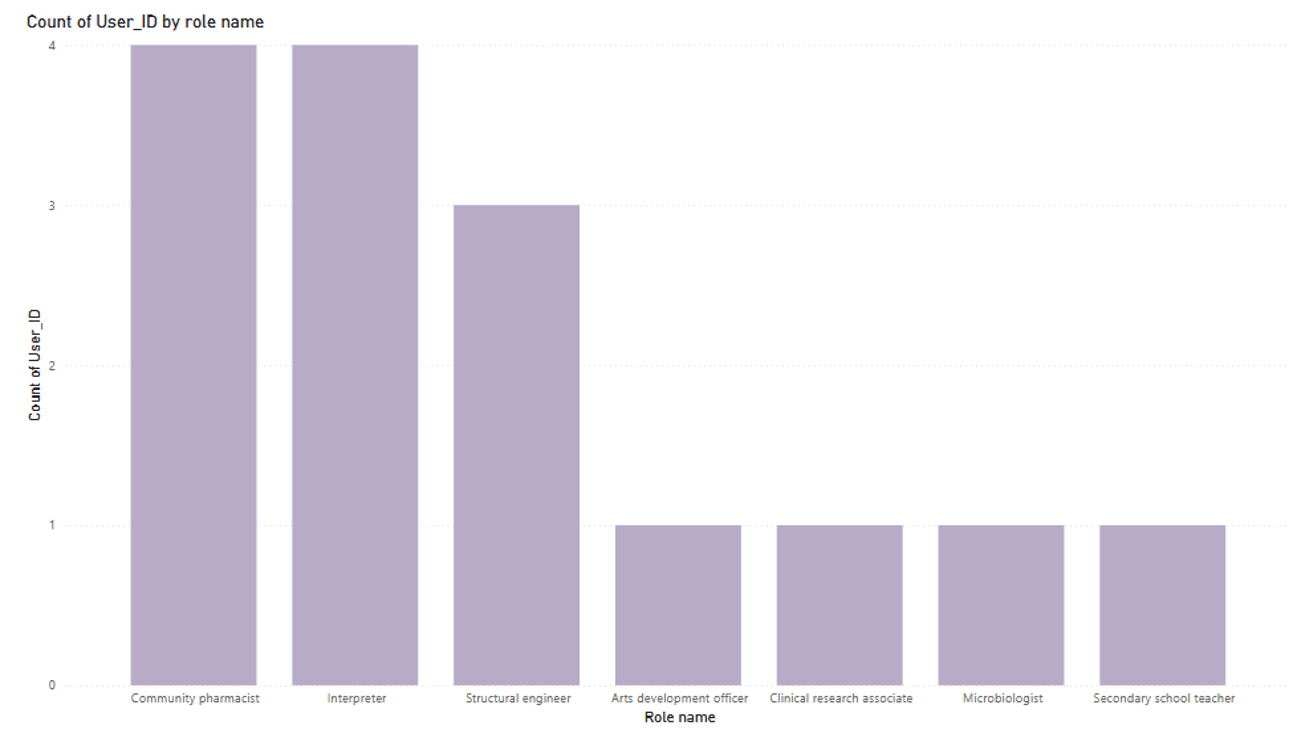
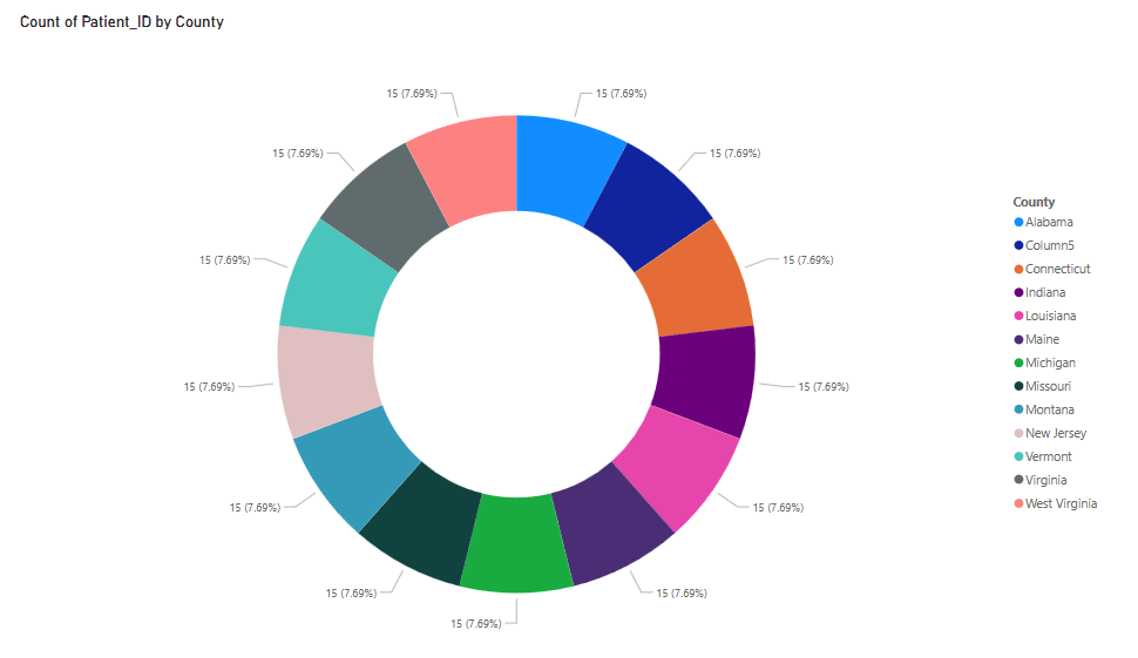
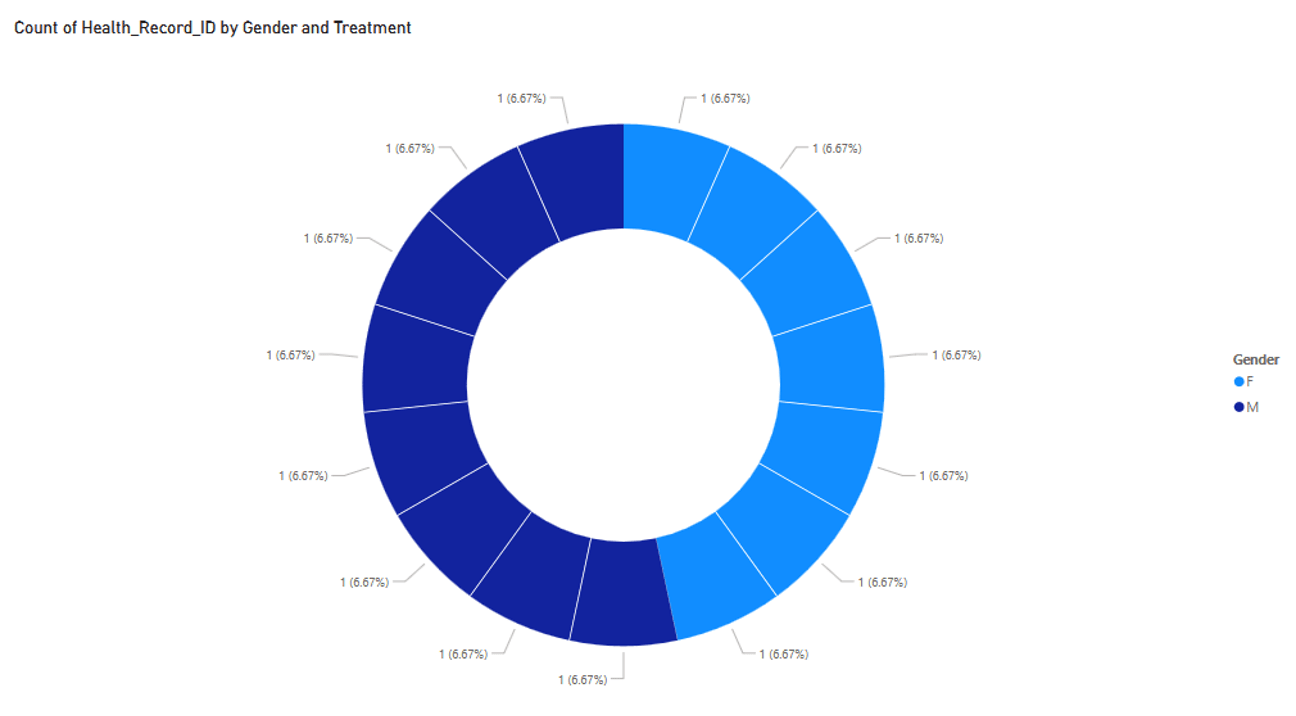
The final dashboard supported dynamic exploration of demographic, geographic, access-role, and treatment patterns instead of leaving insights buried in rows of data.
Process
From problem to validation
Import and inspect
Loaded the Excel workbook and reviewed table structure, formatting, and data quality before modeling.
Clean and transform
Removed duplicates and empty rows, corrected data types, and merged or appended queries where needed.
Model the analysis
Created calculated columns and DAX measures to support accurate comparisons and reusable metrics.
Design the experience
Built charts, maps, tables, slicers, and filters so the report could answer questions interactively.
Evidence
Implementation and validation
Skills demonstrated